Break-even Lift analysis
There are many KPIs for trade promotion analysis. Not only do we have a lot of measures, many of these analytical TPM KPIs are challenging to calculate.
Example TPM KPI Challenges:
- You don’t have the data to calculate the KPIs unless you have a good TPM solution in place.
- Sometimes even a TPM solution doesn’t have the updated data when you need it to make a trade promotion approval decision.
- Some KPIs require a baseline, which can be subjective and open to interpretation.
- If the baseline is too low, lift is overstated, cost-per-incremental-unit is understated, and you run deals that you shouldn’t.
- If the baseline too high, the reverse situation and you pass on deals that you should run.
Simple TPM KPI solution:
There is one simple KPI that includes both promotion effectiveness and efficiency. This calculation only requires one number; the product’s variable profit margin. Use this KPI to answer the fundamental question:
How much incremental volume do we need to generate the same total dollar profit as at full price?
Break-Even Lift = ( ( % profit margin) / (% profit margin minus % discount) ) * 100 ) - 100
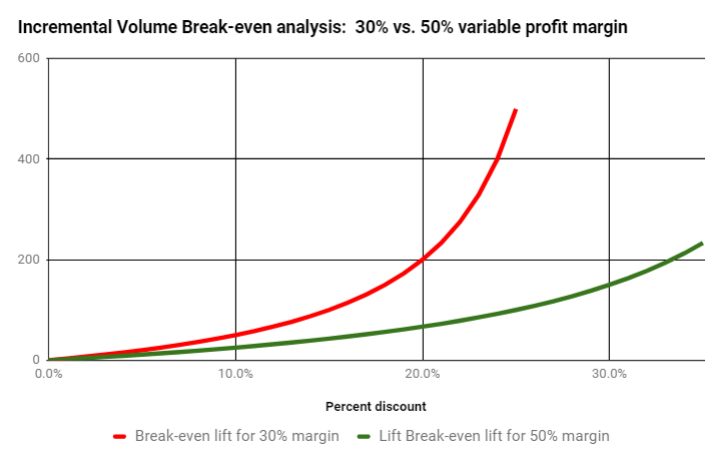
Let’s use this simple KPI in the graph at the top of this blog to compare two products with different variable profit margins:
- Find 20% discount on the horizontal axis. Follow it up to the red line, and then follow the horizontal grid line left to the vertical lift axis to the value of 200:
- The red and green lines represent the break-even point where the incremental volume is just enough to off-set the reduced profitability of the promotional discount.
- Example: At a 20% discount, we need 200% more volume to break if our margin is 30% (red line), but only 67% more if our margin is 50% (green line).
- Any promotions that generate lift above the break-even line will generate incremental profit. Those below the line will not.
- If a fixed promotional fee drives your effective percent discount to 30%, there’s no way the promotion could ever break-even if your profit margin is 30%.... but it could if your variable profit margin is just 20 points higher.
How to Use this KPI:
Here are two examples of how to apply this simple KPI in your trade promotion decisions:
- Quick ‘sanity test’ for promotions: When promotion profitability is a consideration, compare the estimated or forecasted lift to the break-even lift. Is it realistic to expect this future deal will generate enough incremental volume to break-even or better?
- Strategic planning:
- When doing promotions across an entire product line, compare the minimum, maximum and average break-even lifts for products in within the line promotion. If your profit margin varies greatly across products, consider alternatives to line promotions where all products receive the same discount.
Pros and Cons of using the a break-even KPI:
Pros:
- The calculation is simple.
- You only need to know the product’s variable profit margin to start using this KPI in your trade promotion workflows and approval process.
Cons:
- Not all stakeholders have access to variable profit margins.
If you have promotion approvers that are allowed to know your variable profit margin, consider using a Break-Even Lift KPI as part of your review.
Alex Ring, President
CG Squared
